Browse My Recent
Projects
WAK Mayang Website
Created at June 2025
WAK Mayang provides up-to-date information on civil registration services in Kecamatan Silo, Mayang, and Mumbulsari — including submission methods, self-downloadable forms, service schedules, and important announcements. All in one place.
Hidrologi-PUPR Website
Created at February 2024
Hidrologi-PUPR is a collaborative project with Direktorat Jenderal SDA BBWS Brantas - Kementerian PUPR. You can view the distribution of 'Hydrology Stations' and 'Water Quality Monitoring Stations' in each area using the map.
Coffe Chain Sales Analysis
Created at June 2022
This Tableau dashboard analyzes coffee chain sales, showcasing profit, sales, COGS, margin, sales achievement, inventory composition, actual vs. target comparison, statewise sales and profit, and a comprehensive data summary. It also includes a storyline with insights for business evaluation and planning.
Exploratory Data Analysis of Airbnb New York City Using Python
Created at April 2022
This EDA of Airbnb NYC aims to analyze the Airbnb market in New York City, serving as a guide for business strategy development by Airbnb hosts or for planning by potential renters.
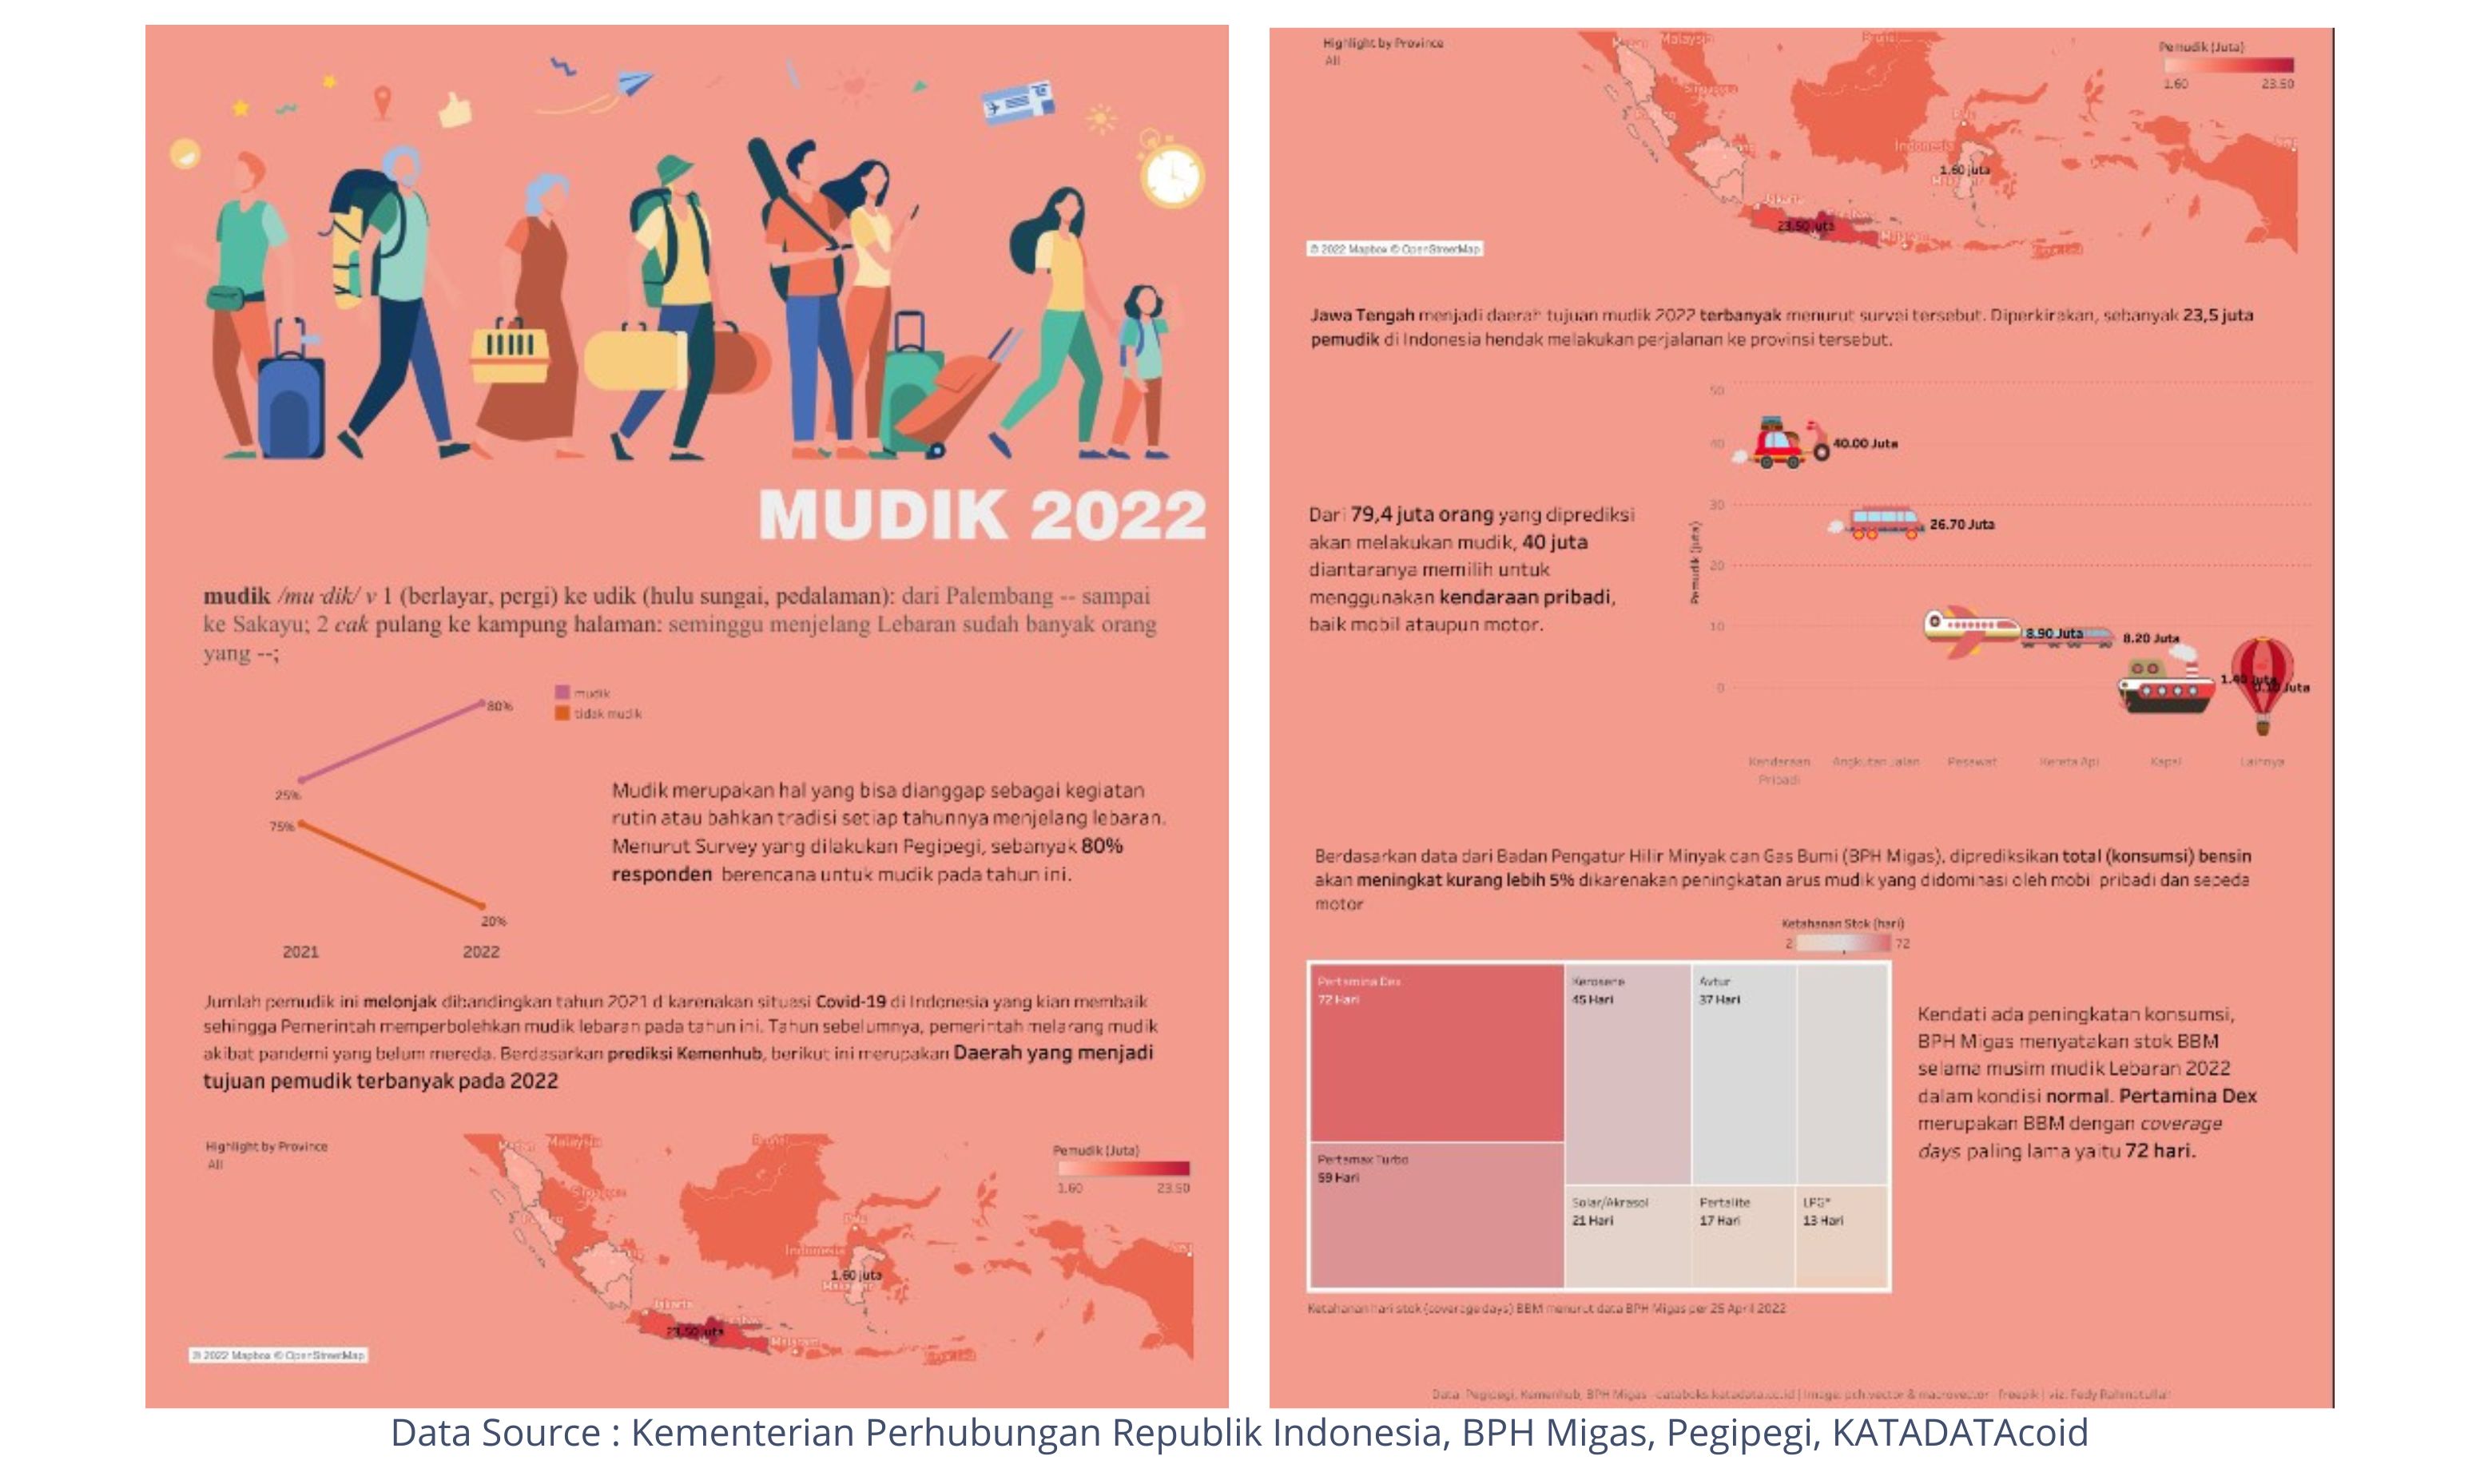
Indonesia Mudik 2022
Created at April 2022
Visualizing the 2022 mudik phenomenon in Indonesia: traveler percentages, popular destinations, transportation used, and fuel availability.
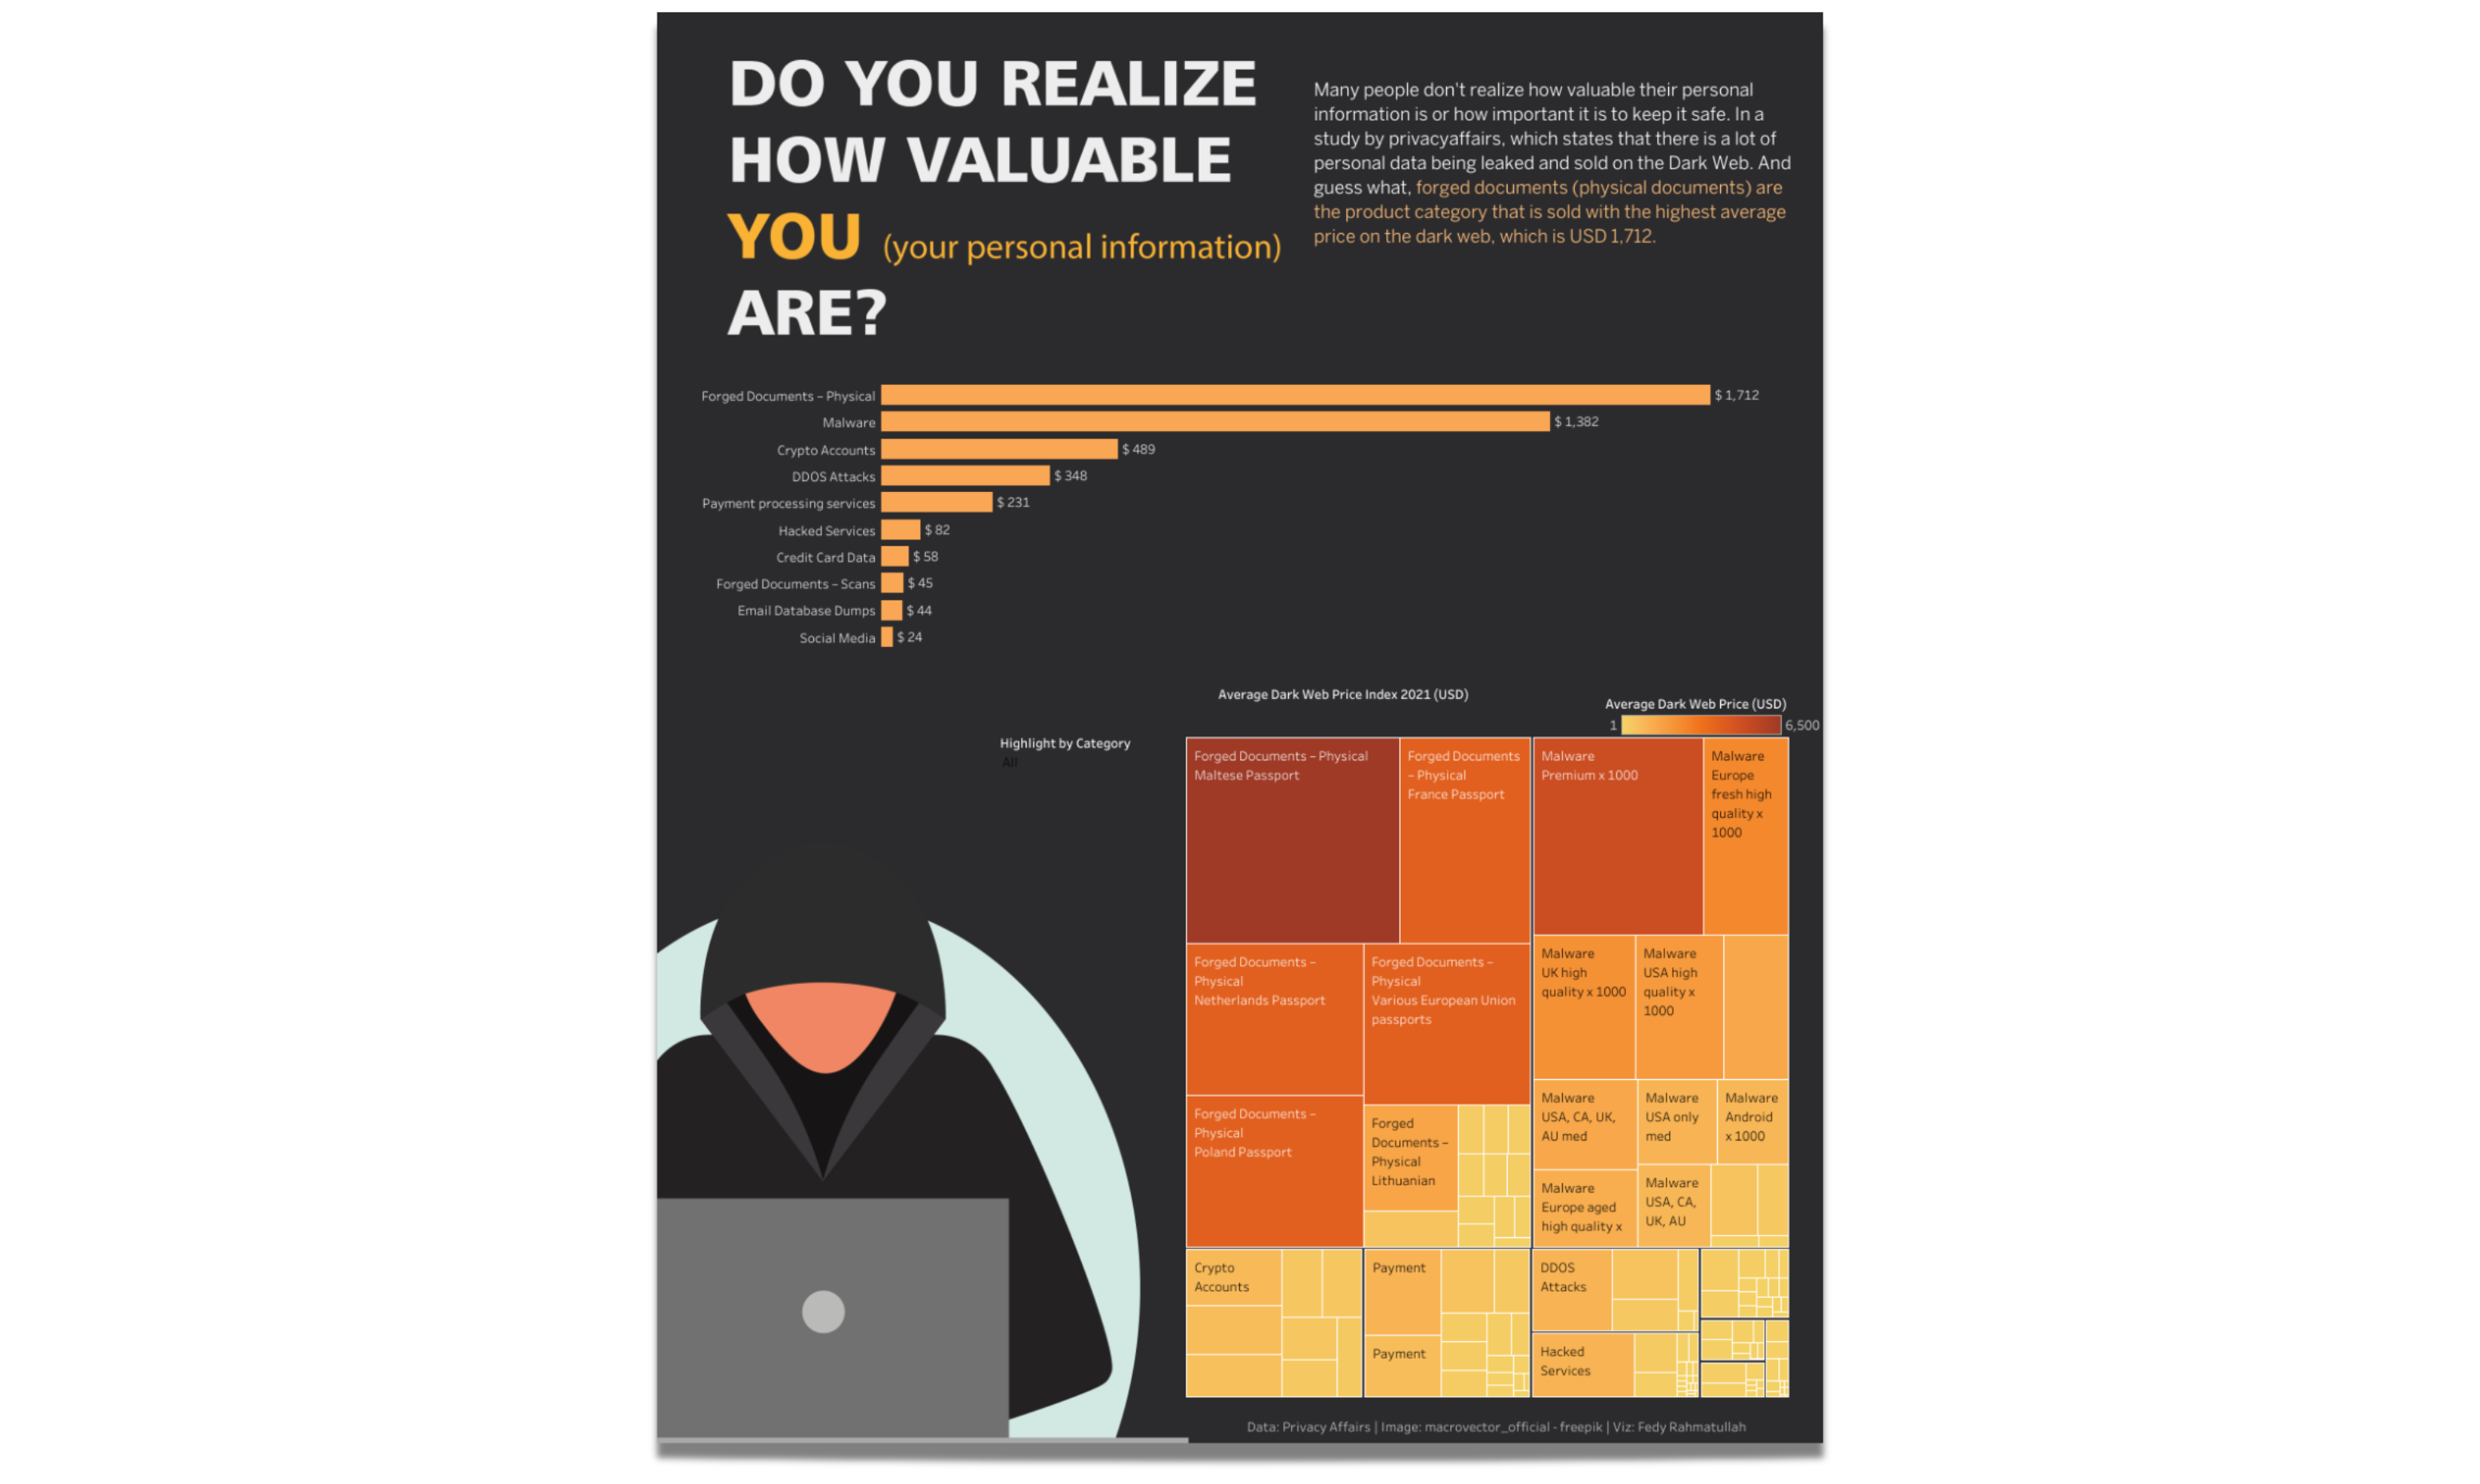
Dark Web Price Index 2021 Analysis
Created at April 2022
“DO YOU REALIZE HOW VALUABLE YOU (your personal information) ARE?” This visualization shows the price index for personal information on the dark web, focusing on categories, products, and average prices.
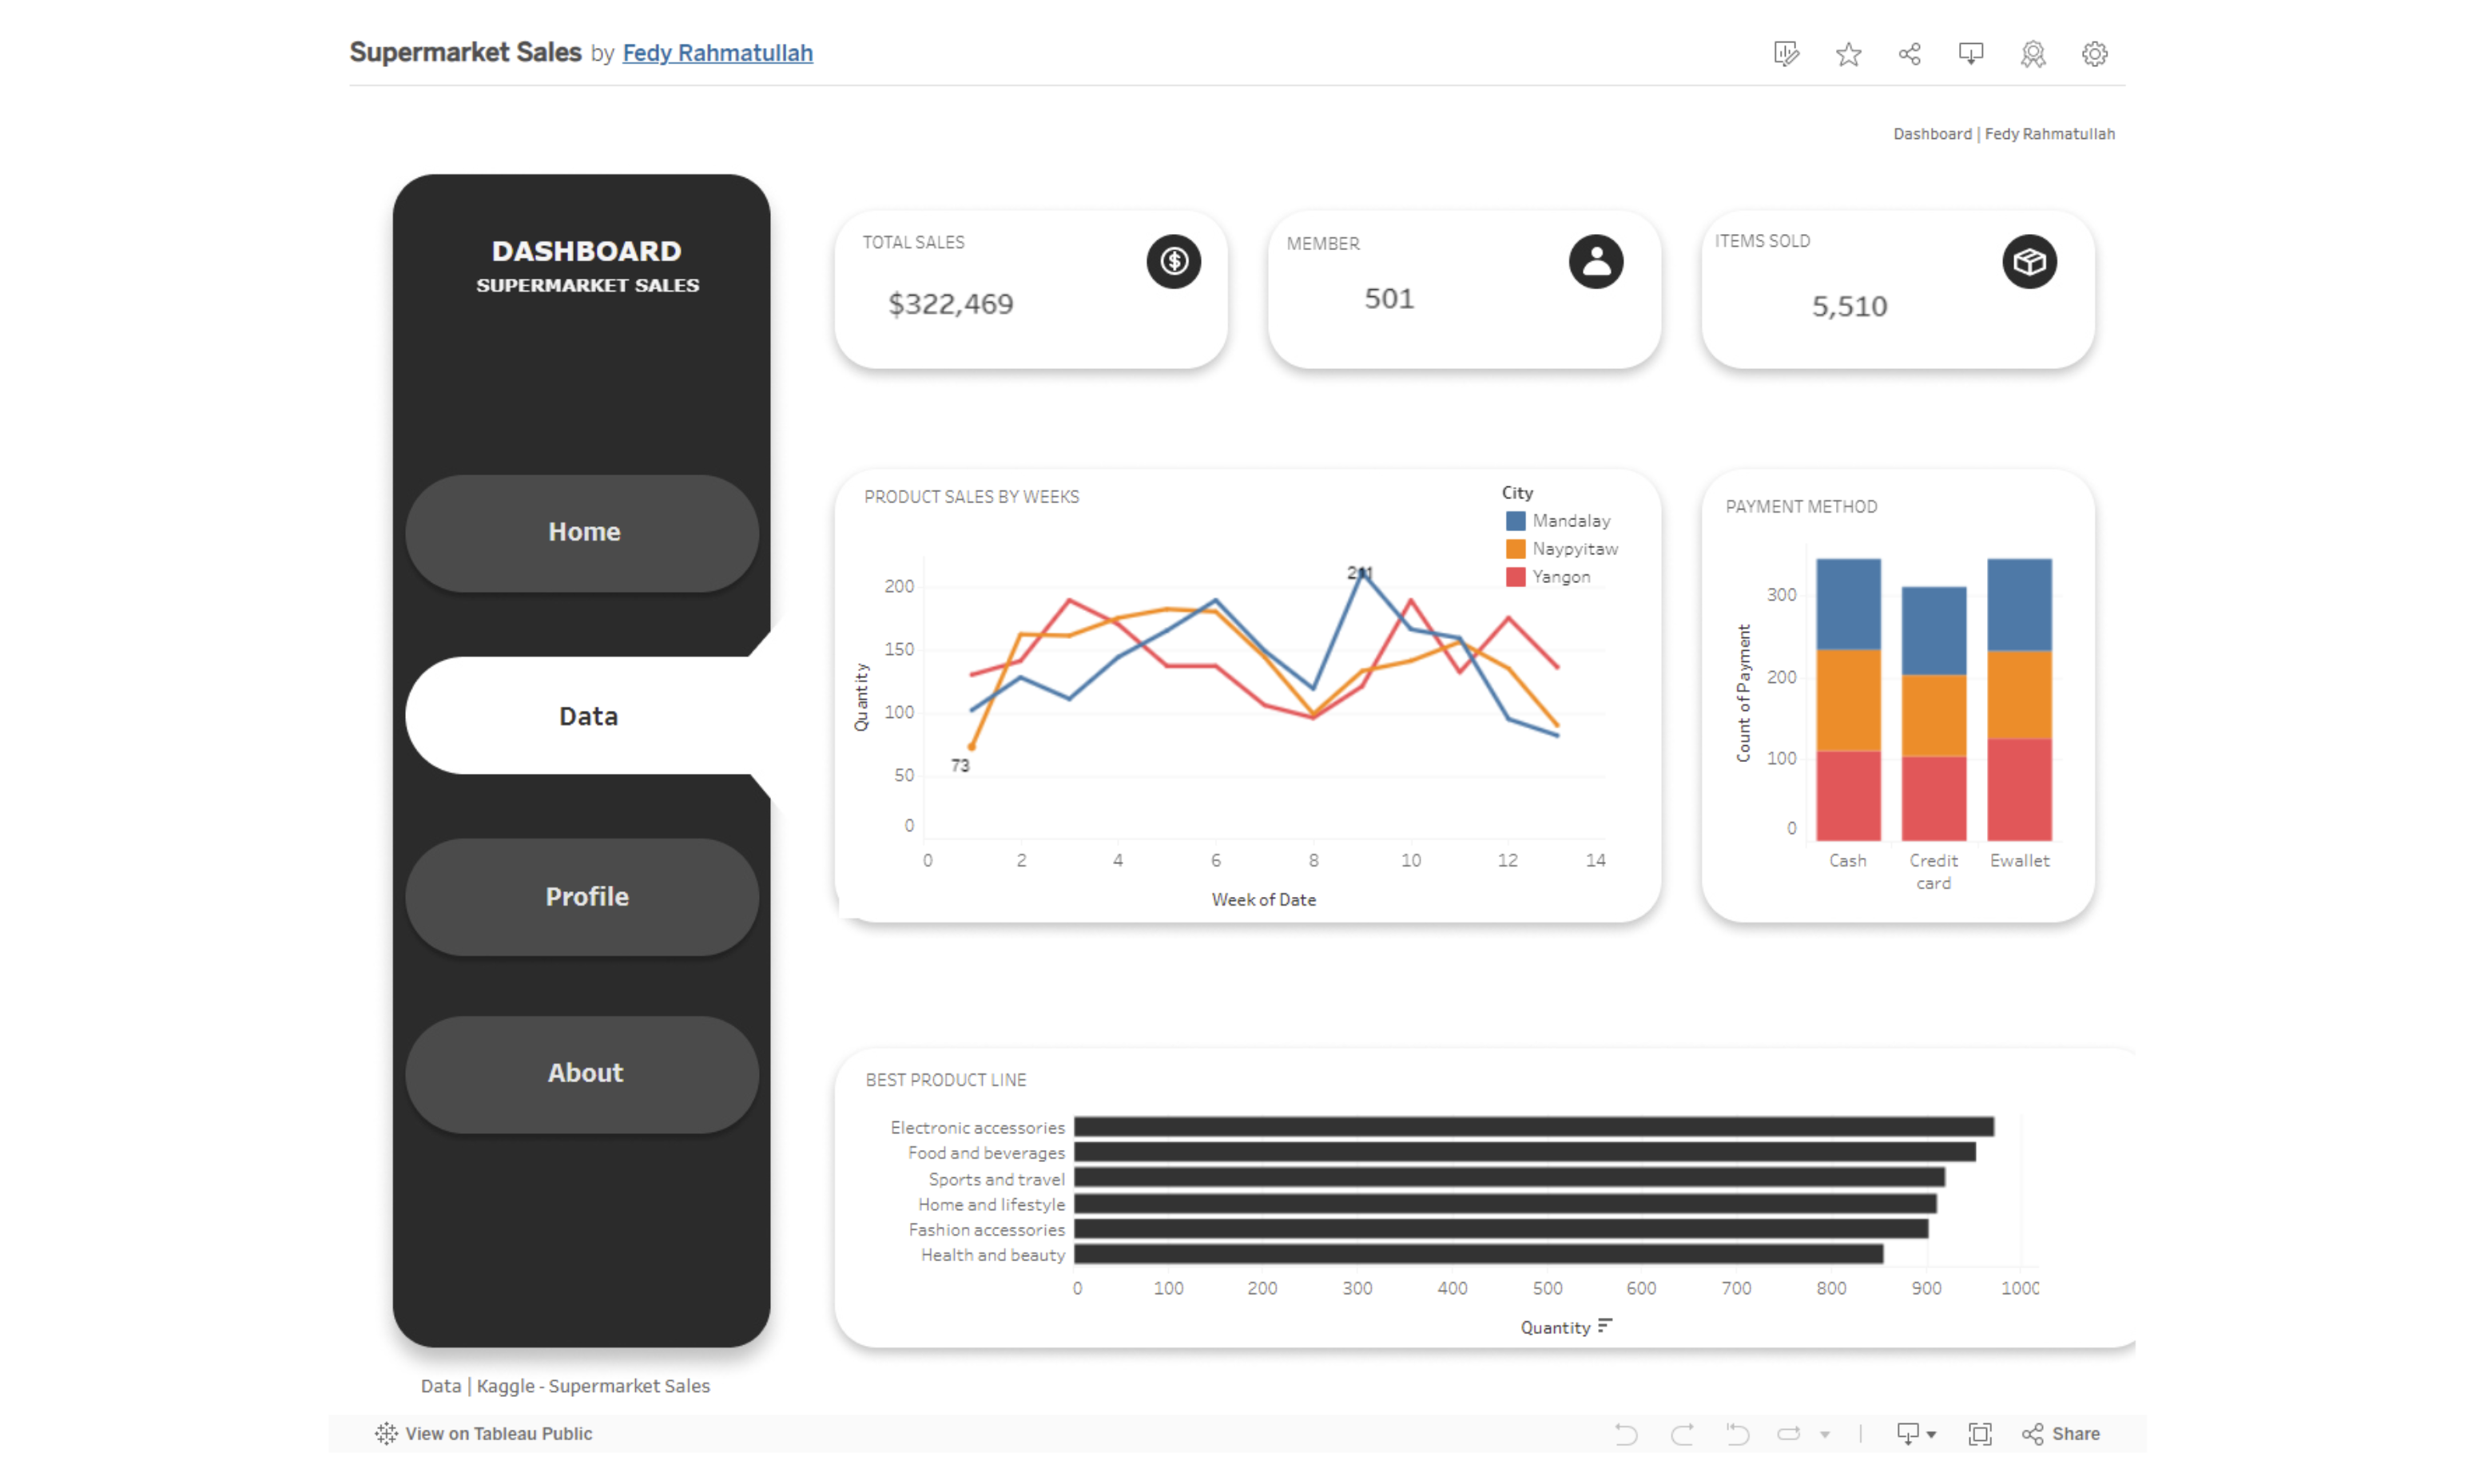
Supermarket Sales Dashboard
Created at April 2022
Visualized with Tableau, this dashboard offers insights into supermarket sales. It includes total sales, member count, items sold, weekly product sales analysis, payment method breakdown, and top product line performance. This data can be utilized for evaluation and sales strategy planning.